Non-negative matrix factorization

In line with my previous post, I would like to take a look at using a technique called Nonnegative matrix factorization for creating an unsupervised learning classifier. The idea is given a matrix with no negative entries, factor the matrix into two other matrices such that their product is approximately equal to the original matrix. Assuming such a factorization exists, we can extract information from the resulting matrices that help describe the dependencies of the entries in the original matrix. By knowing the dependencies, we can see what elements are related to each other, and group them accordingly. Let's do an example by hand first with A, a 4x2 matrix :

A = [1 1;
     2 1;
     4 3;
     5 4];
Suppose we discover two matrices W and H such that W*H approximately equal to A:
W = [0.29291    1.85124;
     1.94600    0.26850;
     2.53183    3.97099;
     2.82474    5.82223];

H = [0.97449    0.44915;
     0.38599    0.46911];

W*H = [1.0000    1.0000;
       2.0000    1.0000;
       4.0000    3.0000;
       5.0000    4.0000];
What do the values in W and H say about the data in A? Let's examine just row 3 in W*H:
2.53183 * 0.97449 + 3.97099 * 0.38599 % = 4.0000
2.53183 * 0.44915 + 3.97099 * 0.46911 % = 3.0000

We notice that 3.97099 from row 3 of W is greater than 2.53183 of the same row. This means that row 3 in the result of W*H will be more heavily influenced by the second row of H ([0.83599 0.46911]). By looking at which column is greater in W, we can divide the data into two groups, one group more influenced by the first row of H (row 2 of A), and another group more influenced on the second row of H (rows 1, 3, & 4 of A). Using this logic, we can treat H as a sort of basis for the entries in W. Using this understanding of the matrices W and H, we can say that W defines which group an entry in A belongs where H defines the basis of the entire group. By controlling the dimensions of W and H, we can chose how many groups we want the factorization to create.

There has been much research into algorithms that actually can find the nonnegative matrix factorization of a matrix, but I will show just one of the most basic and earliest ones originating with Lee and Seung. Essentially the algorithm begins with an initial guess of W and H and then iteratively updates them using a rule proven not to increase the error of the approximation of A. Here is an Octave/Matlab implementation:

function [W, H] = nnmf(A, k)
%nnmf factorizes matrix A into to matrices W, H such that W*H ~= A
% A must be non negative
% k is used to define the dimensions of W and H
m = size(A, 1); % # of rows in A
n = size(A, 2); % # of cols in A
W = rand(m, k);
H = rand(k, n);

for i = 1:1500
   % update rule proven to not increase the 
   % error of the approximation
   % when cost = (1/2) * sum(sum((A - W*H) .^ 2));
   W = W .* (A * H') ./ (W*H*H' + 10^-9);
   H = H .* (W' * A) ./ (W'*W*H + 10^-9);
end
end
Using this algorithm, we can now create a classifier based on nonnegative matrix factorization. We start with a set of points and then decide how many groups we want to classify the data into. When then supply this information into the algorithm to get a factorization.
X = [1 1;
     2 1;
     4 3;
     5 4];
[W H] = nnmf(X, 2)

W =
   1.12234   0.19811
   0.31776   1.80444
   2.56244   2.20065
   3.68479   2.39876

H =
   0.71766   0.81862
   0.98200   0.41003

Now to better see the classification, we can create a matrix Wn, such that the 1 entry in each row is the maximum column from W for that row. This will indicate which group a data entry belongs.

Wn =
   1   0
   0   1
   1   0
   1   0

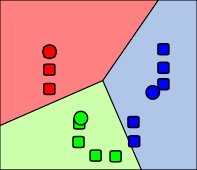
So given the original 4 data points, we have classified them into two groups. Similarly to k-means clustering, this algorithm can be used to group extremely complex groups of data, such as web results, documents, spam, etc. Please comment if I can explain more clearly or missed any crucial information.

k-means clustering

k-means clustering is a technique used to categorize some data points into k distinct groups. This is an example of an unsupervised learning classifier where an algorithm refines an initial guess without training data to determine the groupings. Usually the "similarity" of two different data entries is based off some idea of a difference or distance to other data points. Graphically, the goal of k-means clustering can be easily demonstrated by plotting points and grouping them by colorization:
2d points colored into groups

The algorithm works off of the ideas of centroids, which represent the "center" of the clusters of data (represented by circles in the illustration). The algorithm's inputs are the data and an initial guess at the k different centroids, usually chosen at randomly. Next the algorithm takes each data point and computes which cluster the point is closest to, and thus assigns that data point to that particular cluster. Now that every point is assigned to one of the initial guessed at clusters, the new centroids (center of all the points assigned to each cluster) are calculated. Now that there are new centroids, the cluster assignment may have change, so the algorithm goes back and recalculates the distances. This process is repeated until the clusters no longer change.

Since this algorithm may fail to find the "best" clustering assignment due to a poor initial guess, the algorithm is usually run with multiple different initial guesses. The next step would be to determine which clustering assignment was "best" using some heuristics or other mechanisms.

I have implemented the algorithm in Octave, a software package with capabilities similar to Matlab. The implementation works on any dimensionality data, allowing greater flexibility than just classifying dyads.
% Our data points, in this case 2d points, but could be in any dimension
% Each row represents a data point, each column represents a dimension
X = [1 1; 2 1; 4 3; 5 4];

% Our initial guess at the centroids, in this case the first two data points
centroids = [1 1; 2 1];

% Make a function call to my k-means clustering function
[centroids, clusterAssignment] = kMeansCluster(X, centroids);
The bulk of the work is done in the function kMeansCluster. The function works by first calculating which clusters each data point belongs to, and then updating the centroids accordingly. The function then repeats until the cluster assignment fails to change. The function takes advantage of the trivial function distance I wrote, which just calculates the distances between two points using Euclidean distance, but could be any "distance" mechanism appropriate for your data collection.
function [centroids, clusters] = kMeansCluster(X, initialCentroids)
%KMEANSCLUSTER assign clusters to the data from X based on 
% euclidian distance

% initialize centroids to the initial guess
centroids = initialCentroids;
k = size(centroids, 1); % number of clusters
m = size(X, 1);         % number of data points
% assign clusters to something random so that the 
% first cluster calculation is not coincidentally the same
% causing the the algorithm to end prematurely
clusters = rand(m, k);  

while 1
   % calculate the new cluster assignment based on the centroids
   % For each row which represents each data point
   % Each columns will be 0 except the column representing 
   % the cluster this point belongs to which will be 1
   newClusters = zeros(m, k);
   for i = 1:m
      % Calculate distance to each centroid
      distances = zeros(1, k);
      for j = 1:k
         distances(j) = distance(X(i, :), centroids(j, :));
      end

      % determine which centroid is closed to this data point
      [temp, index] = min(distances);

      % Set 0 for every cluster for this data point
      newClusters(i, :) = zeros(1, length(newClusters(i, :)));

      % Set 1 for the closest cluster
      newClusters(i, index) = 1;
   end

   % update centroids based on new cluster assignments
   for i = 1:k
      total = zeros(1, size(X, 2));
      count = 0;
      for j = 1:m
         if newClusters(j, i) == 1
            total += X(j, :);
            count++;
         end
      end

      if count == 0
         % prevent divide by zero
         centroids(i, :) = zeros(1, size(X, 2));
      else
         % calculate the average point
         centroids(i, :) = total / count;
      end
   end

   if newClusters == clusters
      % if this is the same as the last cluster, we are done
      break;
   else
      % We have a different cluster assignment, keep iterating
      clusters = newClusters;
   end
end
end
Running of this program will appropriately determine the clusters and output the centroids too:
% Initial data
%
% 5....x
% 4.....
% 3...x.
% 2.....
% 1xx...
% |12345
X = 
    1    1
    2    1
    4    3
    5    3

initialGuess = 
    1    1
    2    1

% [centroids, clusterAssignemnt] = kMeansCluster(X, centroids);
centroids = 
    1.5000   1.0000
    4.5000   3.5000

clusterAssignment = 
    1    0
    1    0
    0    1
    0    1
k-means clustering can be used for many things that may not be obvious based on the visual. For example, we could define a spam classifier algorithm. The 2 clusters would be spam and not spam, the data points would represent email characteristics (possibly with normalization, such as:
  • contains wrist watch offers
  • from someone in address book
  • ...

When we run the classifier on some mail sample, the algorithm will output 2 clusters. Some other method will have to be used to determine which cluster is spam and which cluster is not spam. This algorithm will probably not be as good as Bayesian spam filtering and is heavily dependent on what characteristics you pick, but it does demonstrate k-means clustering's capabilities.

I hope my example k-means clustering algorithm explanation was helpful. Please post any questions in the comments.