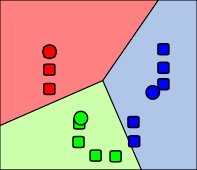
The algorithm works off of the ideas of centroids, which represent the "center" of the clusters of data (represented by circles in the illustration). The algorithm's inputs are the data and an initial guess at the k different centroids, usually chosen at randomly. Next the algorithm takes each data point and computes which cluster the point is closest to, and thus assigns that data point to that particular cluster. Now that every point is assigned to one of the initial guessed at clusters, the new centroids (center of all the points assigned to each cluster) are calculated. Now that there are new centroids, the cluster assignment may have change, so the algorithm goes back and recalculates the distances. This process is repeated until the clusters no longer change.
Since this algorithm may fail to find the "best" clustering assignment due to a poor initial guess, the algorithm is usually run with multiple different initial guesses. The next step would be to determine which clustering assignment was "best" using some heuristics or other mechanisms.
I have implemented the algorithm in Octave, a software package with capabilities similar to Matlab. The implementation works on any dimensionality data, allowing greater flexibility than just classifying dyads.% Our data points, in this case 2d points, but could be in any dimension % Each row represents a data point, each column represents a dimension X = [1 1; 2 1; 4 3; 5 4]; % Our initial guess at the centroids, in this case the first two data points centroids = [1 1; 2 1]; % Make a function call to my k-means clustering function [centroids, clusterAssignment] = kMeansCluster(X, centroids);The bulk of the work is done in the function kMeansCluster. The function works by first calculating which clusters each data point belongs to, and then updating the centroids accordingly. The function then repeats until the cluster assignment fails to change. The function takes advantage of the trivial function distance I wrote, which just calculates the distances between two points using Euclidean distance, but could be any "distance" mechanism appropriate for your data collection.
function [centroids, clusters] = kMeansCluster(X, initialCentroids)
%KMEANSCLUSTER assign clusters to the data from X based on
% euclidian distance

% initialize centroids to the initial guess
centroids = initialCentroids;
k = size(centroids, 1); % number of clusters
m = size(X, 1);         % number of data points
% assign clusters to something random so that the
% first cluster calculation is not coincidentally the same
% causing the the algorithm to end prematurely
clusters = rand(m, k);

while 1
   % calculate the new cluster assignment based on the centroids
   % For each row which represents each data point
   % Each columns will be 0 except the column representing
   % the cluster this point belongs to which will be 1
   newClusters = zeros(m, k);
   for i = 1:m
      % Calculate distance to each centroid
      distances = zeros(1, k);
      for j = 1:k
         distances(j) = distance(X(i, :), centroids(j, :));
      end

      % determine which centroid is closed to this data point
      [temp, index] = min(distances);

      % Set 0 for every cluster for this data point
      newClusters(i, :) = zeros(1, length(newClusters(i, :)));

      % Set 1 for the closest cluster
      newClusters(i, index) = 1;
   end

   % update centroids based on new cluster assignments
   for i = 1:k
      total = zeros(1, size(X, 2));
      count = 0;
      for j = 1:m
         if newClusters(j, i) == 1
            total += X(j, :);
            count++;
         end
      end

      if count == 0
         % prevent divide by zero
         centroids(i, :) = zeros(1, size(X, 2));
      else
         % calculate the average point
         centroids(i, :) = total / count;
      end
   end

   if newClusters == clusters
      % if this is the same as the last cluster, we are done
      break;
   else
      % We have a different cluster assignment, keep iterating
      clusters = newClusters;
   end
end
end
Running of this program will appropriately determine the clusters and output the centroids too:
% Initial data
%
% 5....x
% 4.....
% 3...x.
% 2.....
% 1xx...
% |12345
X =
    1    1
    2    1
    4    3
    5    3

initialGuess =
    1    1
    2    1

% [centroids, clusterAssignemnt] = kMeansCluster(X, centroids);
centroids =
    1.5000   1.0000
    4.5000   3.5000

clusterAssignment =
    1    0
    1    0
    0    1
    0    1
k-means clustering can be used for many things that may not be obvious based on the visual. For example, we could define a spam classifier algorithm. The 2 clusters would be spam and not spam, the data points would represent email characteristics (possibly with normalization, such as:
- contains wrist watch offers
- from someone in address book
- ...
When we run the classifier on some mail sample, the algorithm will output 2 clusters. Some other method will have to be used to determine which cluster is spam and which cluster is not spam. This algorithm will probably not be as good as Bayesian spam filtering and is heavily dependent on what characteristics you pick, but it does demonstrate k-means clustering's capabilities.
I hope my example k-means clustering algorithm explanation was helpful. Please post any questions in the comments.
- Source code released under public domain where available.
- External reference

1 comment:
I actually enjoyed reading through this posting.Many thanks.
Function Point Estimation Training
Post a Comment